Improving Situation Awareness in Collaborative Tabletop Systems
What are tabletop computers?
Digital tabletop computers are large interactive tables that allow users to directly interact with the content. They allow users to work together face-to-face while providing digital functionalities, such as updating map information in command and control and rearranging data to facilitate a discussion of financial reports. Given their benefits in supporting collaboration, they are increasingly being used for complex domains involving dynamic data, such as coastal surveillance and emergency response.
Problem of awareness and automated changes
Maintaining situation awareness of dynamic changes driven by the system is crucial for quick and appropriate response when problems arise. However, distractors in the environment can make users miss the changes and negatively impact their situation awareness, e.g., the large size of the table and conversations with team members. Users could miss automated changes if they were engaging in conversations or focusing on other parts of the tabletop display.
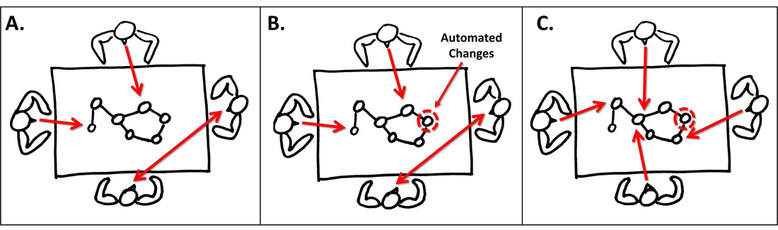
A. During collaboration, users may focus on other collaborators or various parts of the system. Their gazes are illustrated by the red arrows. B. A new change appears as shown by the red circle. C. Users may not notice new changes that just happened since they have been engaging in discussion with each other. They may notice the change with their peripheral vision, but unable to locate it.
Proposed Solution: Interactive Event Timeline
The existing literature shows that interactive event timelines can improve response time and decision accuracy after interruptions for single-user applications. In this project, the timelines were adapted to the context of collaborative tabletop applications to address the lack of situation awareness due to dynamic changes
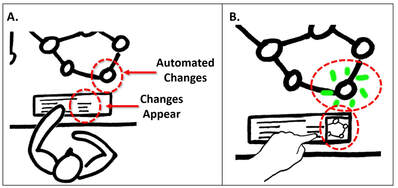
A. This project investigated interactive event timelines which acted as historical logs. The new automated changes are logged on the timeline. B. Users can interact with it to see the details of changes. The feedback may be displayed on the timeline or in context. Feedback on the timeline may allow for faster navigation. Feedback on the shared workspace may better facilitate workspace awareness since other users can keep track of each other’s actions.
Context: Collaborative Board Game
This project uses Pandemic, a commercial turn-based collaborative board game, as a case study. The players work together to control the disease spread and collect cards to win. It requires intense strategizing and forecasting to prioritize moves. The game elicits complex collaborative activities ideal for studying complex domains that require strategizing. In the digital conversion I implemented, the lack of awareness due to automation problem was also observed.
Iterative Design Process
Several iterations were conducted, ranging from low-fidelity sketches to medium-fidelity digital mock-ups and high-fidelity implementations.
Low-fidelity sketches
We started with low-fidelity sketches to explore interactive visualization of changes in the shared game board area and players’ personal spaces (directly in front of them). In our interviews with experienced Pandemic players and HCI experts, the ideas of showing a stripe of historical events on the personal workspace and detailed location-based information on the game map were perceived as the most useful. See below for some of the early sketches.
We started with low-fidelity sketches to explore interactive visualization of changes in the shared game board area and players’ personal spaces (directly in front of them). In our interviews with experienced Pandemic players and HCI experts, the ideas of showing a stripe of historical events on the personal workspace and detailed location-based information on the game map were perceived as the most useful. See below for some of the early sketches.
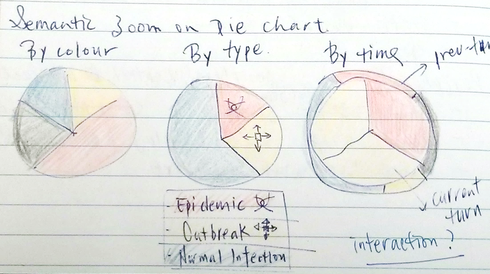
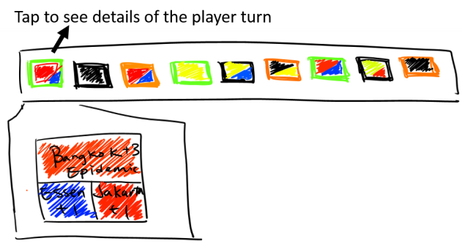
An early design sketch showing aggregated information on changes that have occurred so far in the game using pie menus. The sketch splits the automated changes by region, type, and time. Players can explore the pie menu to get a sense of disease spread in the game.
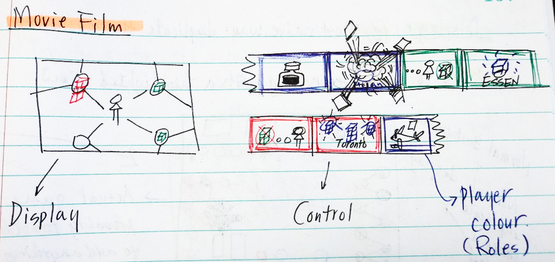
Another early design sketch showing a film strip of automated and player actions that have happened so far in the game. Players can tap on a frame on the strip (right) to see detailed information on the display (left). This design concept allows for exploring specific events that took place.
Medium-fidelity digital mock-ups
In the medium fidelity mock-up phase, we further explored the selected ideas. The designs were expanded and prototyped on a touch-enabled tablet. We conducted Wizard of Oz testing with experienced Pandemic players and HCI experts to understand the usefulness and effectiveness of the designs. See below for some of the medium-fidelity prototypes.
In the medium fidelity mock-up phase, we further explored the selected ideas. The designs were expanded and prototyped on a touch-enabled tablet. We conducted Wizard of Oz testing with experienced Pandemic players and HCI experts to understand the usefulness and effectiveness of the designs. See below for some of the medium-fidelity prototypes.
This prototype is a timeline (top) that builds up as automated events take place. It shows a summary view (bottom) of events for each turn. Each block in the timeline at the top shows a summary of events that took place, and the colours are consistent with the original board game design.
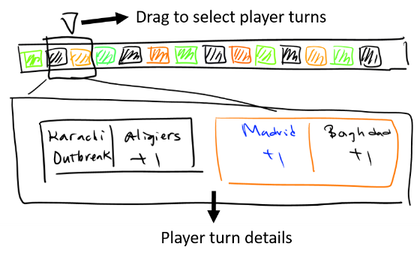
This prototype is another version of the timeline concept. The timeline (top) builds up as automated events take place. Players can drag a pointer to see events happened in the selected player turn.
High-fidelity implementation
The high-fidelity prototypes were implemented on the tabletop computers and the ideas were further distilled, refined, and tested. See figure below for the final design of the timeline and the feedback triggered on the game map. For more details of the interface, please refer to the publications under Publications & Presentations at the end of this page. For a quick preview of the timeline design, please see the video at the top of this page.
The high-fidelity prototypes were implemented on the tabletop computers and the ideas were further distilled, refined, and tested. See figure below for the final design of the timeline and the feedback triggered on the game map. For more details of the interface, please refer to the publications under Publications & Presentations at the end of this page. For a quick preview of the timeline design, please see the video at the top of this page.
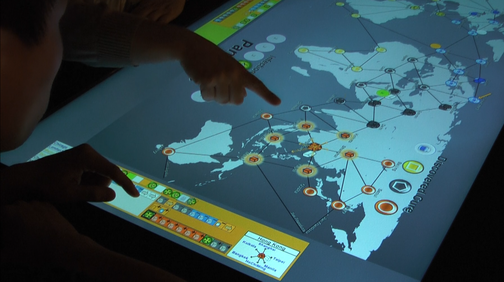
High-fidelity implementation of interactive event timeline concept. The timeline shows an overview bar of all players’ turns and players can drag a viewport to see more detailed information. Players can also select a specific event to play an animated effect on the map to draw other players’ attention.
Evaluation: Lab Study
A lab study was conducted to understand the effectiveness of the timeline for addressing the lack of awareness issue. Twelve groups of three experienced Pandemic players who knew their teammates participated in the study.
Study conditions
The study consisted of 2 main phases. The first was a controlled study where we tested out specific configurations of the timelines to understand players’ perception and change in behaviours. In the second phase, players played a full game with configurable timelines in order to collect data on a more realistic usage of the timelines. The configurable timelines allowed players to freely open and close the timelines at any time. They can also decide where feedback of their interaction would appear (on the timeline as a cutout map, on the board as animations, or at both places).
Data collection & analysis
Participants filled out questionnaires on their situation awareness, gaming experience, and preferences of different design factors, and they were interviewed at the end of the study. Furthermore, I collected screen, audio, and video recordings of the game sessions as well as software loggings of their interactions with the timelines and the game. The data was analyzed both quantitatively and qualitatively (e.g., RM-ANOVA, Pearson Correlations, text/video coding, and affinity diagraming).
Key questions and findings
Some of the key questions include:
Our results showed that the timelines were used by players as 3 timelines were the most kept mode throughout the gameplay (M = 85% of the gameplay time, SD = 27%).
There was a wide variability in how frequent feedback location was used, but showing feedback both on the board and on the timeline was the most used during the game (M = 61% of the gameplay time, SD = 42%). Showing feedback at both locations was described as “best of both worlds” by the players because the cut-out map on timeline allowed for fast access and the board animation provided spatial context.
However, my observation showed that the replay animation triggered by user interaction on the board was easily confused with automated changes. During the game, P5 mistook the animation triggered by P6 as new outbreaks by the system, and announced “Bogota just outbroke!” He then quickly realized that it was a replay animation triggered by P6, and said “oh no, you are just smashing things. I hate you! I hate the board thing! Turn your board off, please!” P6 then turned off the feedback on the map.
The video-coding data revealed that 81.7% of the timeline interaction was for checking the automated changes that happened in the current term. This results shows that the timeline was used for players gain awareness.
Study conditions
The study consisted of 2 main phases. The first was a controlled study where we tested out specific configurations of the timelines to understand players’ perception and change in behaviours. In the second phase, players played a full game with configurable timelines in order to collect data on a more realistic usage of the timelines. The configurable timelines allowed players to freely open and close the timelines at any time. They can also decide where feedback of their interaction would appear (on the timeline as a cutout map, on the board as animations, or at both places).
Data collection & analysis
Participants filled out questionnaires on their situation awareness, gaming experience, and preferences of different design factors, and they were interviewed at the end of the study. Furthermore, I collected screen, audio, and video recordings of the game sessions as well as software loggings of their interactions with the timelines and the game. The data was analyzed both quantitatively and qualitatively (e.g., RM-ANOVA, Pearson Correlations, text/video coding, and affinity diagraming).
Key questions and findings
Some of the key questions include:
- Were timelines used by players?
- How well did the feedback locations support awareness of collaborators?
- How was timeline used for gaining awareness of automated changes?
Our results showed that the timelines were used by players as 3 timelines were the most kept mode throughout the gameplay (M = 85% of the gameplay time, SD = 27%).
There was a wide variability in how frequent feedback location was used, but showing feedback both on the board and on the timeline was the most used during the game (M = 61% of the gameplay time, SD = 42%). Showing feedback at both locations was described as “best of both worlds” by the players because the cut-out map on timeline allowed for fast access and the board animation provided spatial context.
However, my observation showed that the replay animation triggered by user interaction on the board was easily confused with automated changes. During the game, P5 mistook the animation triggered by P6 as new outbreaks by the system, and announced “Bogota just outbroke!” He then quickly realized that it was a replay animation triggered by P6, and said “oh no, you are just smashing things. I hate you! I hate the board thing! Turn your board off, please!” P6 then turned off the feedback on the map.
The video-coding data revealed that 81.7% of the timeline interaction was for checking the automated changes that happened in the current term. This results shows that the timeline was used for players gain awareness.
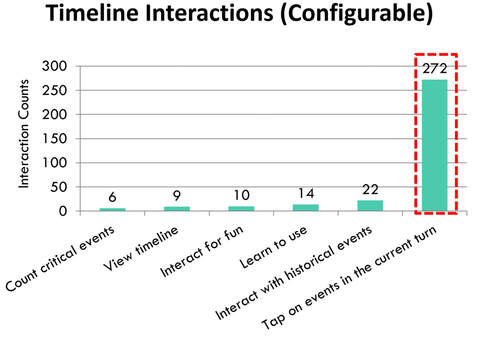
Based on video-coding analysis, timelines were mostly used for checking automated events that happened in the current turn (272 times out of 1377 counted instances).
Furthermore, I generated a heatmap of interaction with the timeline generated from touch points logged during the study. The heatmap also confirmed that the timeline was mainly used for perceiving the automated changes that took place.
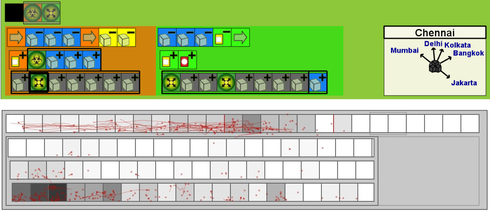
This heatmap and interaction path trace is generated based on interactions from all groups in the individual-both condition. It is overlaid on top of a timeline. It shows a lot of interaction at the bottom left corner which is where the new automated changes would show up after new automated actions take place. The heatmap confirmed that timeline was mainly used for perceiving the automated changes that took place.
The video coding analysis also revealed that players next use the game board to discuss and make sense of the new information on automated changes they just gathered. For strategizing, forecasting, and deciding on their next actions, they refer to the discard pile of cards, which shows a summary list of critical events that took place recently.
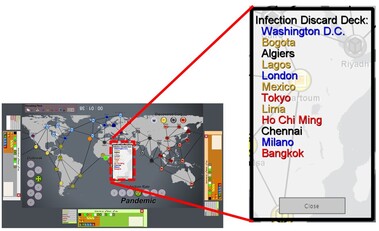
The discard pile shows a summary list of critical events that took place recently. Players used this information to strategize, forecast, and decide on their next steps.
Insights
Some of the key lessons learned through this study include the following:
For more details of the project and the future work, please see the Publications and Presentations section below.
- Promote interactivity: The fact that participants chose to use the timeline showed its benefits. Our statistical analysis also showed that more interactions with timelines led to higher awareness of the situation.
- Support flexible work patterns: Players work pattern was very fluid. They switched between strategizing and interacting with timelines a lot. A successful design needs to support such flexibility by providing individual tools and still allow for awareness of each other. The animated feedback on the board needs to provide more awareness of who triggered it to support players’ awareness of each other’s actions.
- Consider the needs at different stages of awareness: In terms of maintaining awareness of automated changes, the timeline was successful in making changes readily available for players. For supporting strategizing, forecasting, and decision making, a summary of critical events was preferred.
For more details of the project and the future work, please see the Publications and Presentations section below.
My Roles
- Planned and executed research milestones to investigate awareness visualizations for the tabletop strategy game, including literature review, iterative design process, software development, and user experiment
- Directed software development process based on insights of players’ perception and behaviour derived from quantitative and qualitative methods, including survey, interview, observation, statistical analysis, and video analysis
- Disseminated, published, and presented the research findings at conferences and workshops
- Supervised undergrad and master's students in prototyping and data analysis
Collaborators
- T.C. Nicholas Graham - Queen's University
- Mark Hancock - University of Waterloo
- Phillip McClelland - University of Waterloo
- Mylène Mengual - University of Waterloo
- Joseph Pape - Queen's University
- Brian Parfett - University of Waterloo
- Stacey D. Scott - University of Waterloo
- James R. Wallace - University of Waterloo
Publications & Presentations
- Chang, Y.-L. B., Scott, S. D., Hancock, M. (2016) Usage of Interactive Event Timelines in Collaborative Digital Tabletops Involving Automation. C. Anslow, P. Campos & J. Jorge, (Eds.), Collaboration Meets Interactive Spaces. Springer international publishing, pp. 203-232
- Chang, Y.-L.B., Scott, S.D., Hancock, M. (2014). Supporting Situation Awareness in Collaborative Tabletop Systems with Automation. Interactive Tabletop and Surfaces, pp. 185-194
- Chang, Y.-L.B., Mengual, M., Parfett, B., Graham, T.N., Hancock, M., Scott, S.D. (2013) Improving Awareness of Automated Actions using an Interactive Event Timeline. Interactive Tabletop and Surfaces, pp 353-356
- Chang, Y.-L.B. (2012) Improving Awareness of Automated Actions within Digital Tabletops. Interactive Tabletop and Surfaces, pp. 283-288
- Chang, Y.-L.B., Scott, S.D., Hancock, M., Pape, J., Graham, T.C.N. (2012) Improving the Social Gaming Experience by Comparing Physical and Digital Tabletop Board Games. In Extended Proc. 4th International Conference on Fun and Games, Presented in Workshop on Conceptualising, Operationalising and Measuring the Player Experience in Videogames, pp. 108-111
- Wallace, J.R., Pape, J., Chang, Y.-L.B., McClelland, P. J., Graham, T.C.N., Scott, S.D., Hancock, M. (2012) Exploring Automation in Digital Tabletop Board Games. In Proc. Computer Supported Cooperative Work Companion, pp. 231-234
- Chang, Y.-L.B., Scott, S.D., Hancock, M., (2014). Improving Situation Awareness with an Interactive Event Timeline in Collaborative Tabletop Interfaces. Presented at The 5th Annual GRAND Conference (Graphics, Animation and New Media), Ottawa, ON, May 14-16, 2014
- Chang, Y.-L.B. Improving Awareness of Automated Actions within Digital Tabletops. Presented at The 14th Annual Human Factors Engineering Inter-University Workshop, Waterloo, ON, November 16, 2013